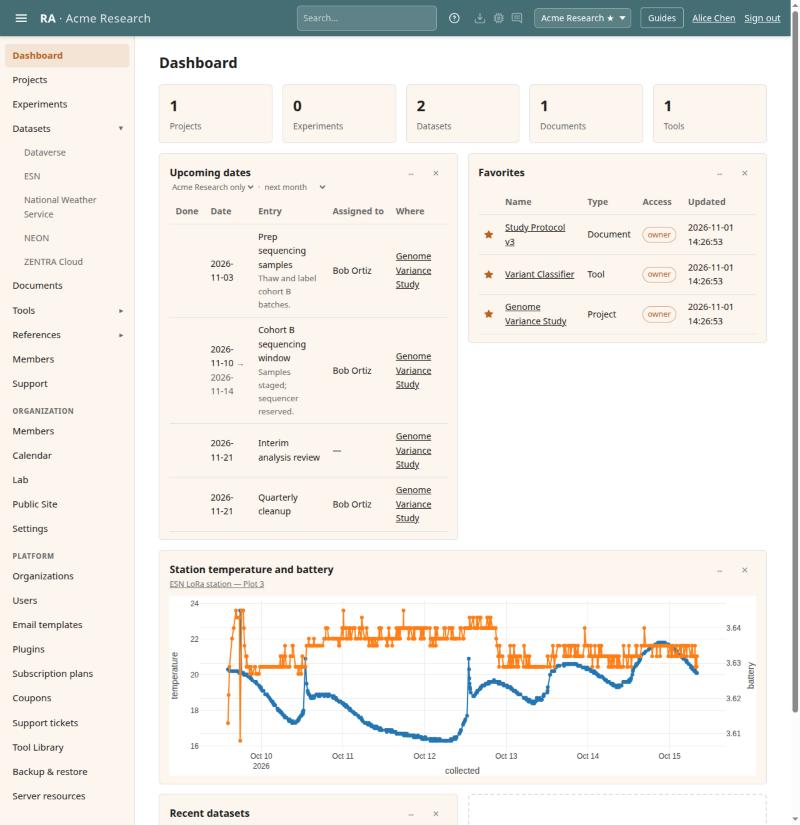
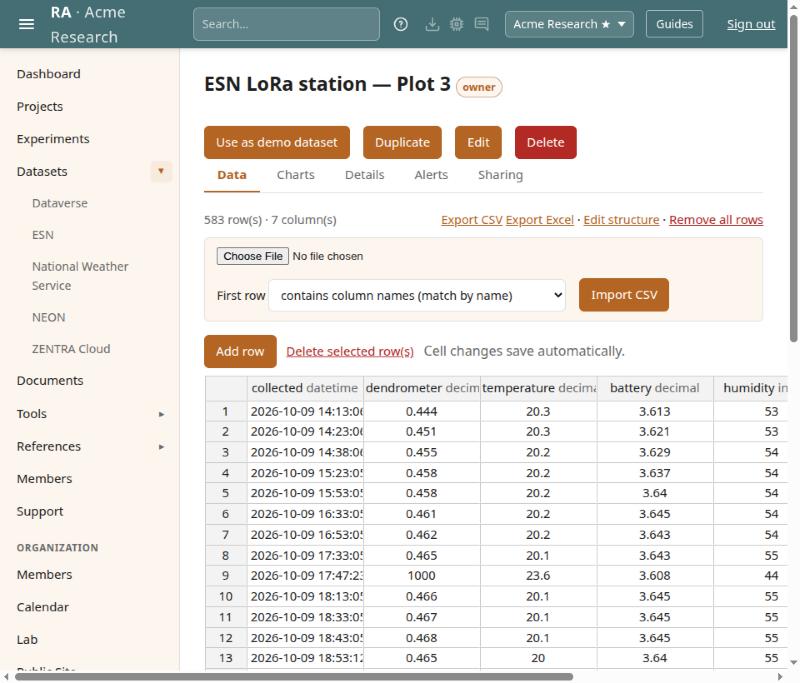
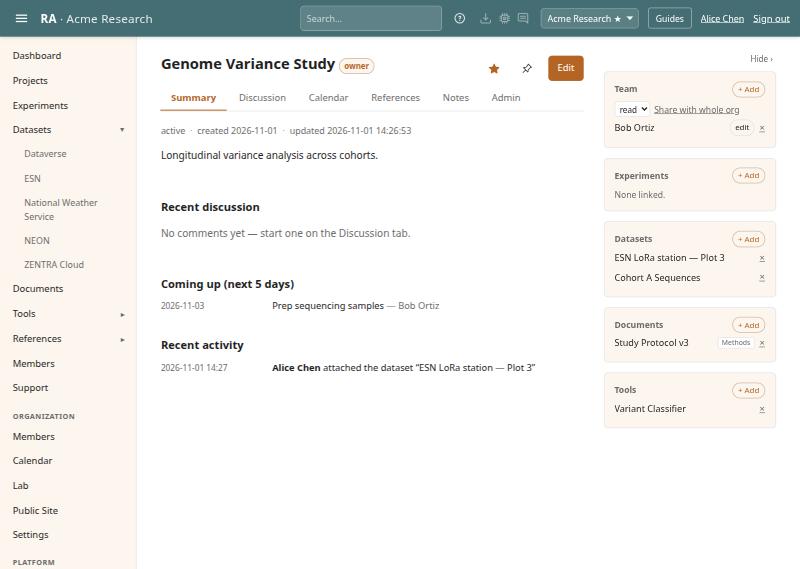
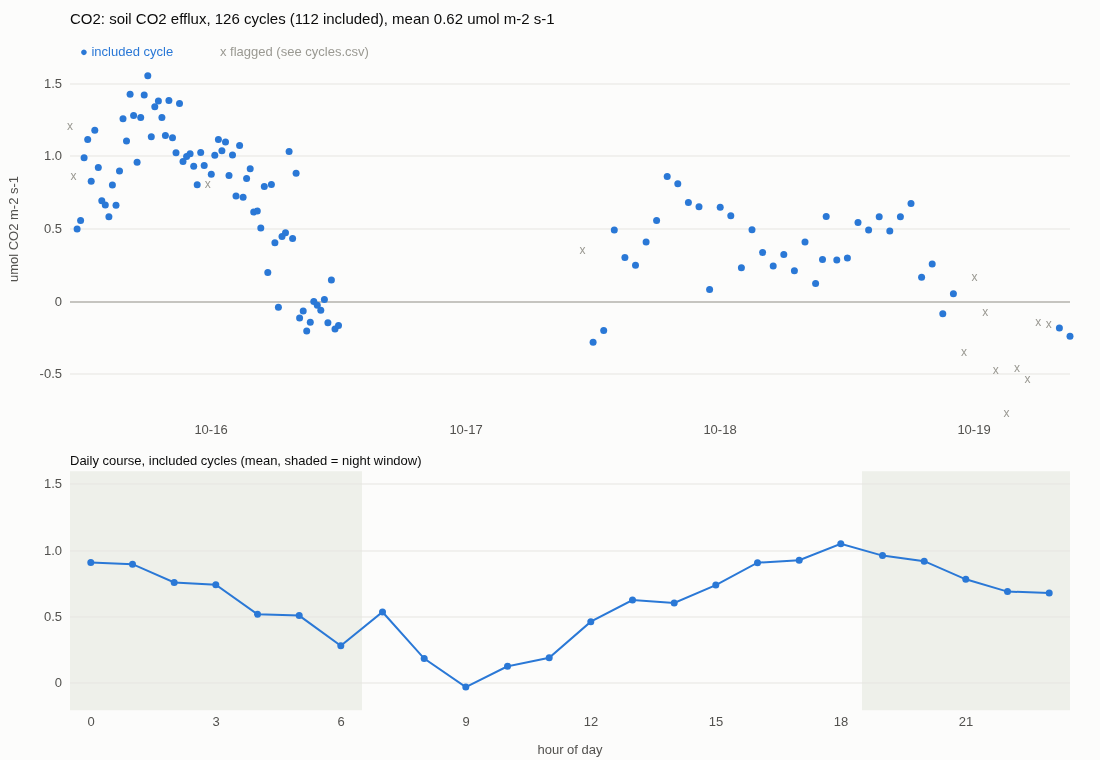
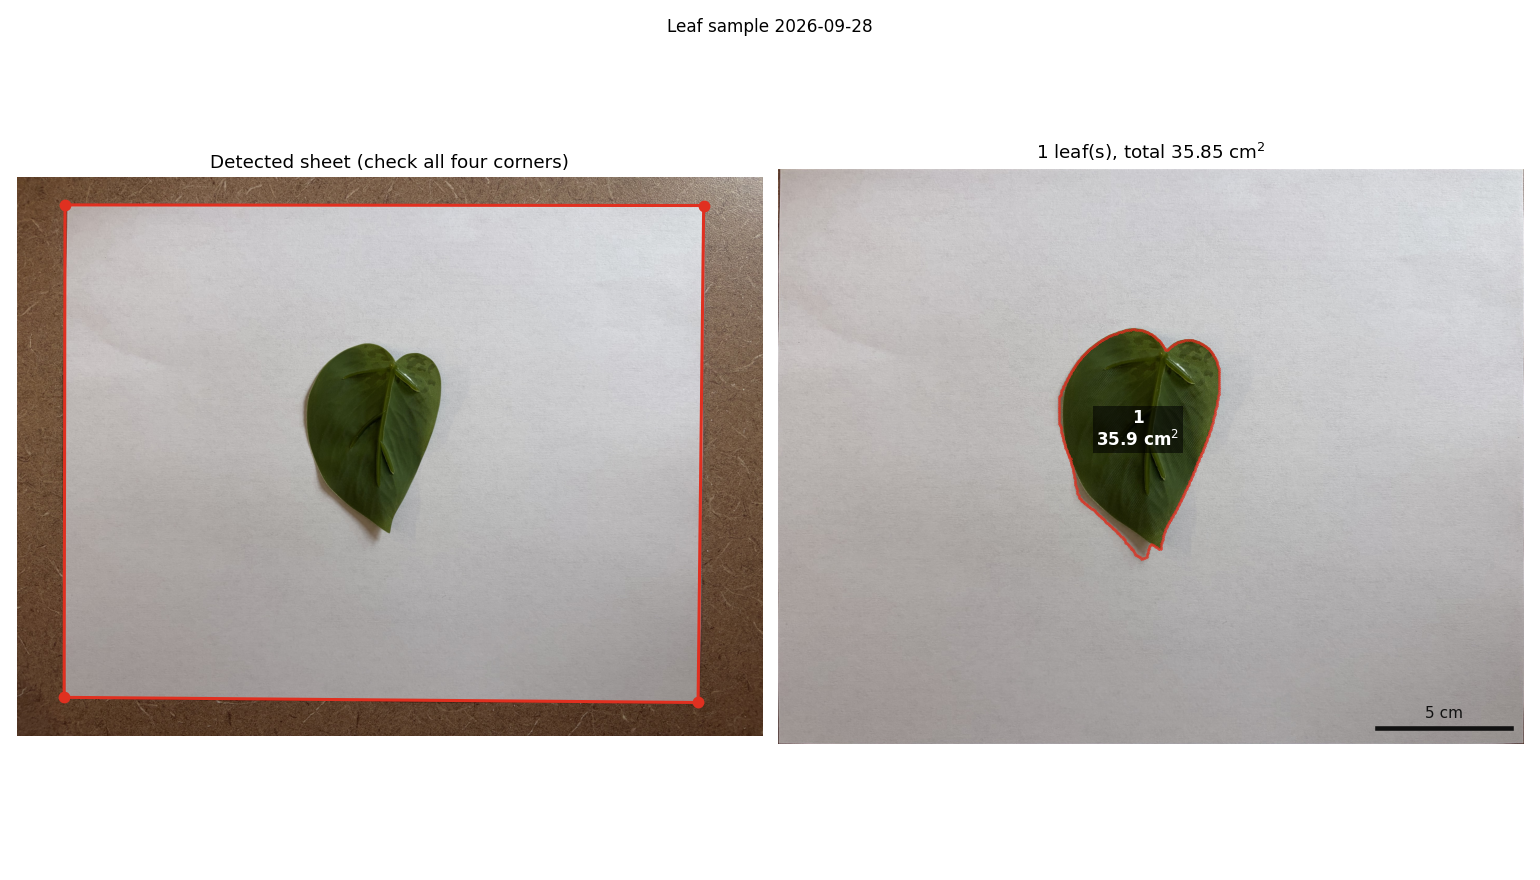
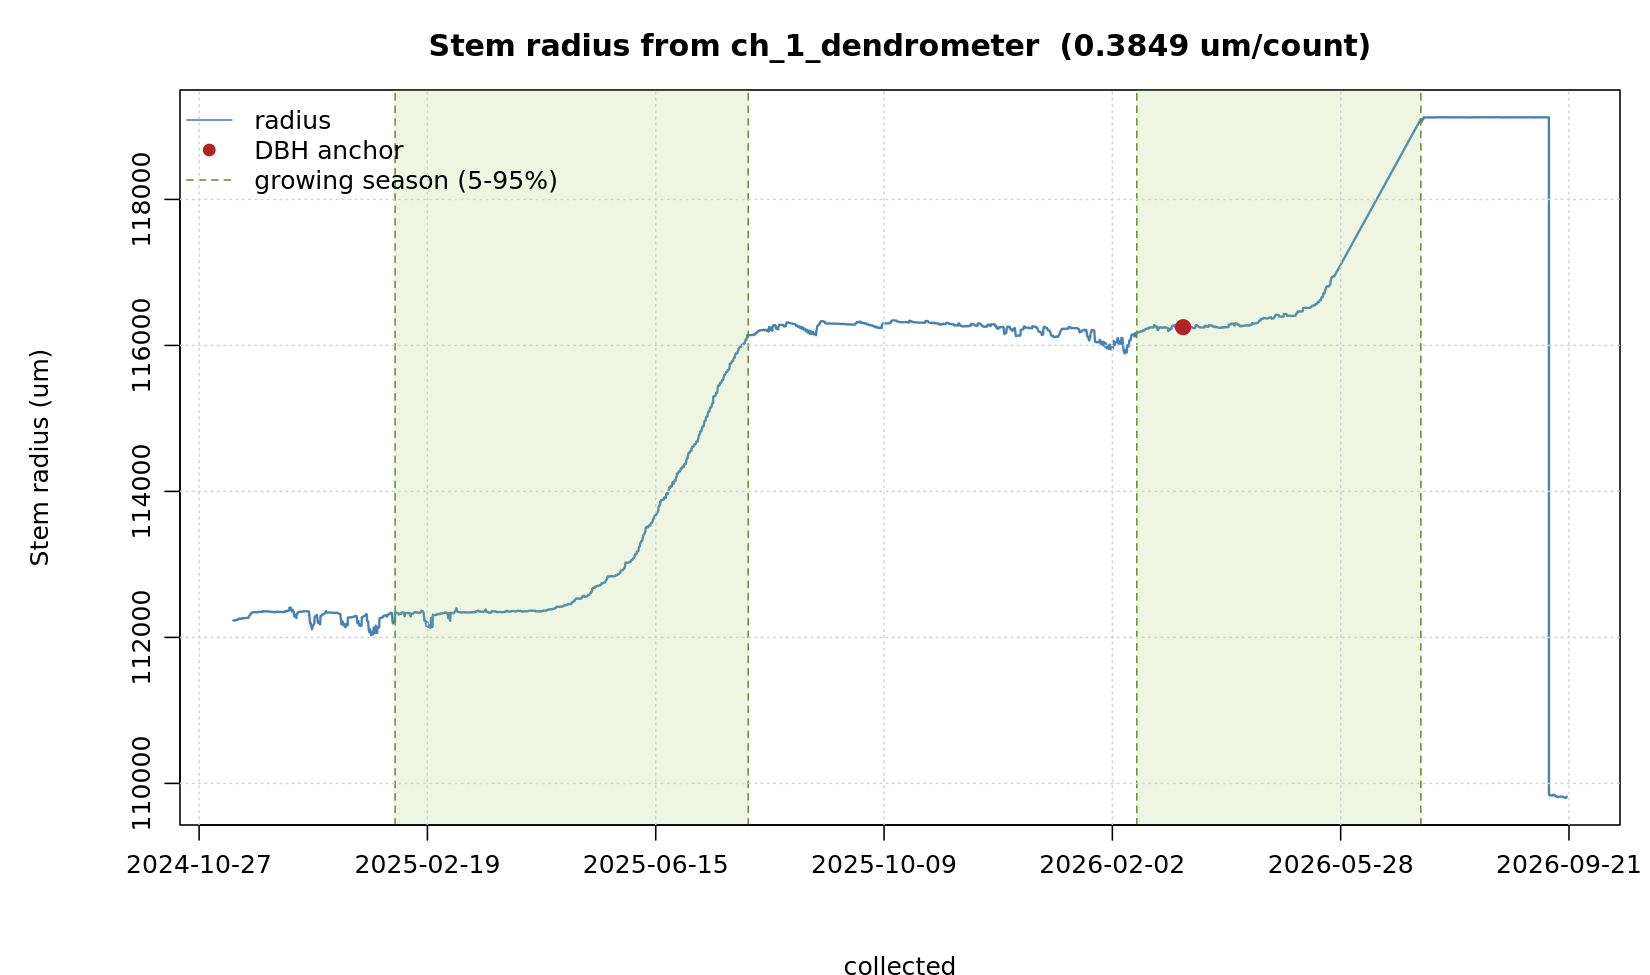
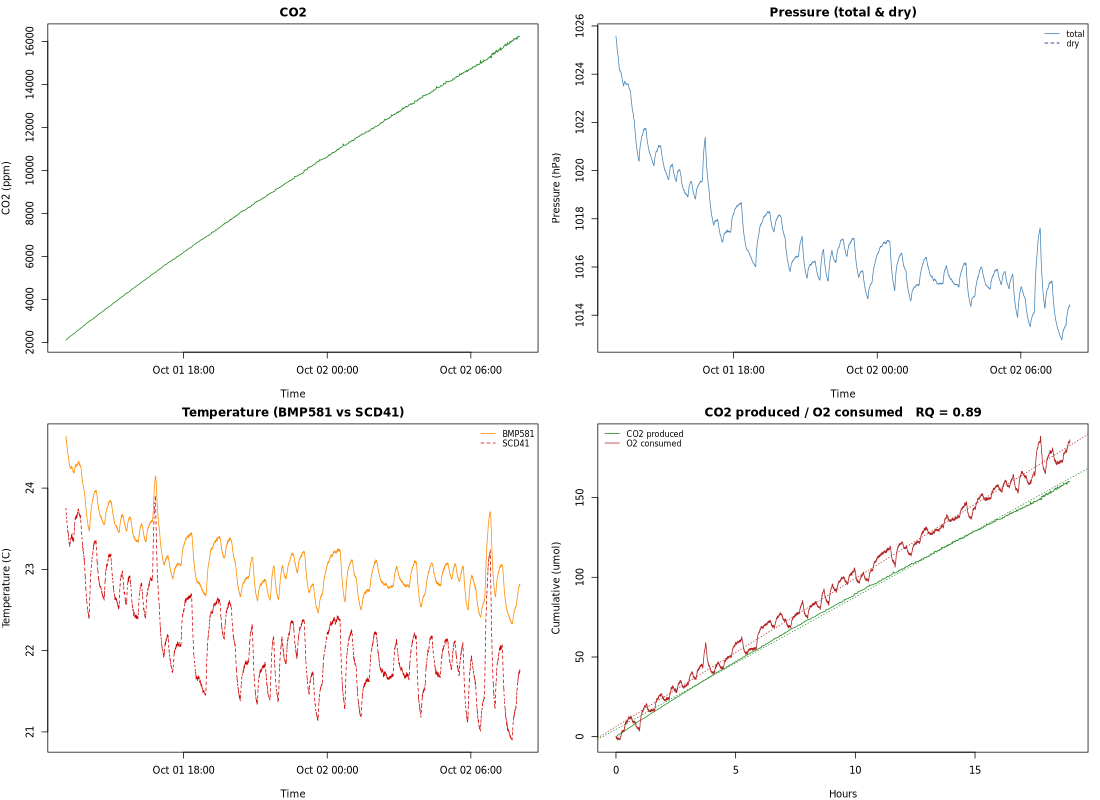
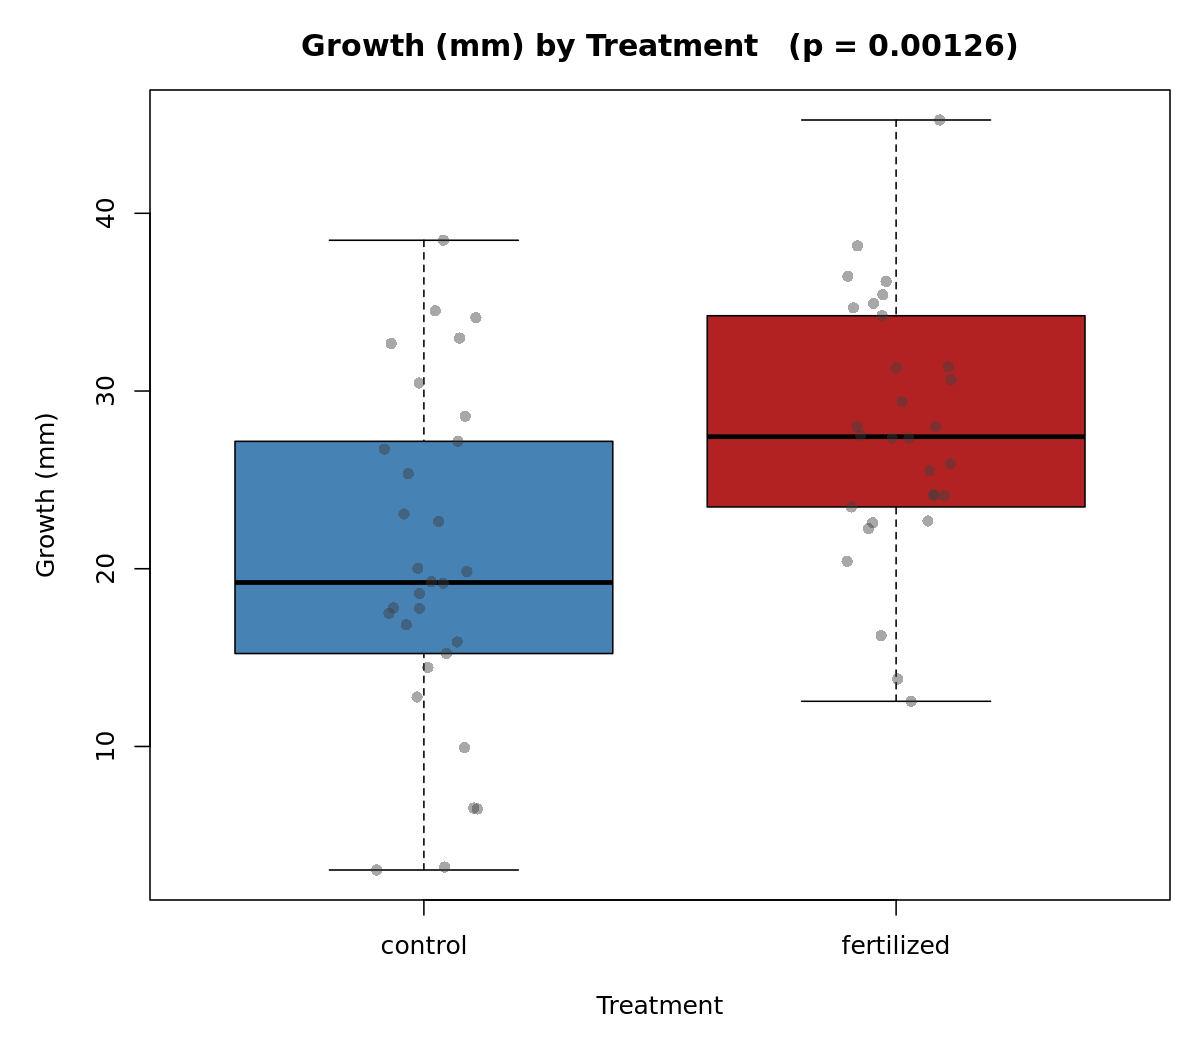
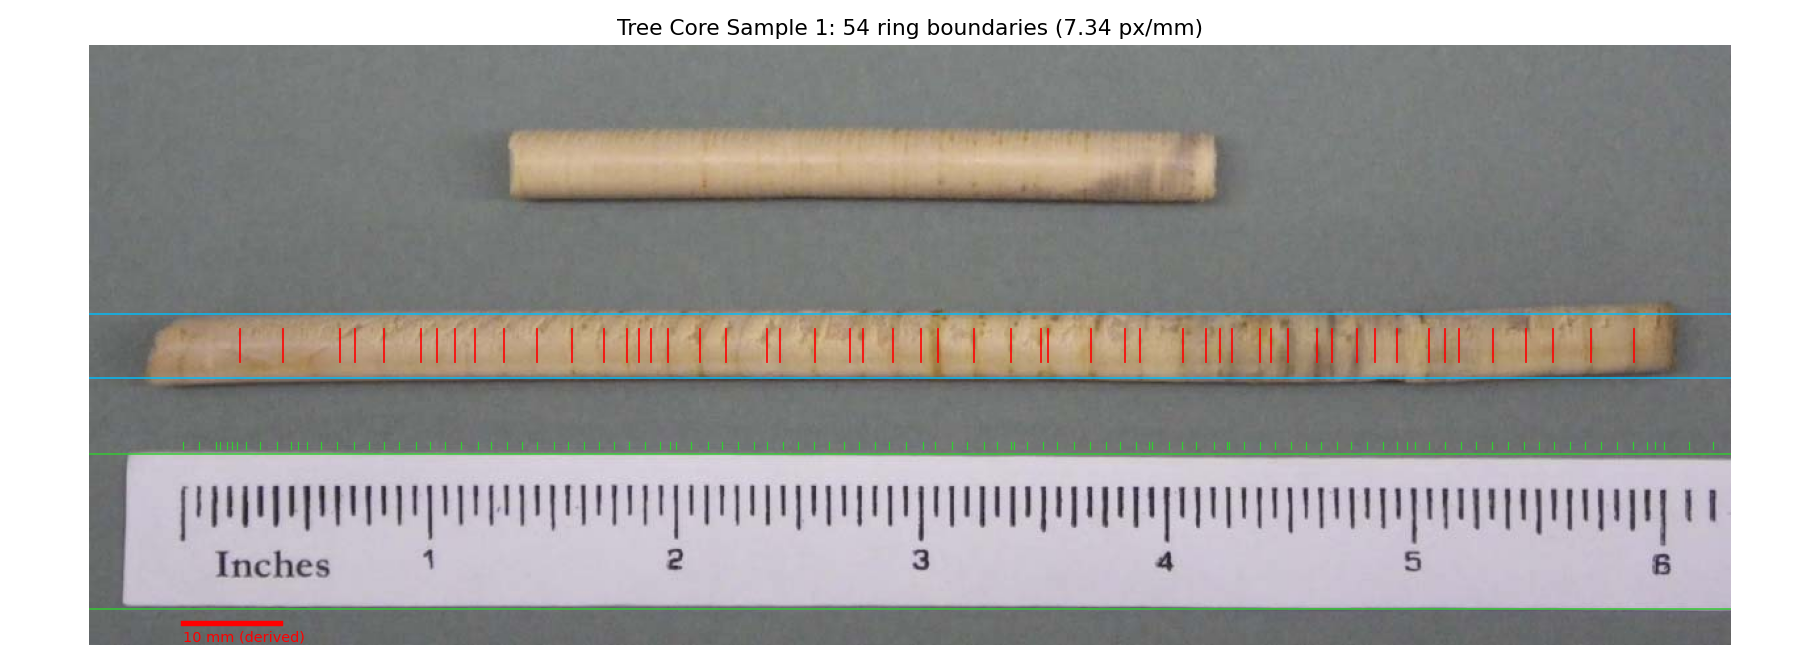
Your dashboardTiles you compose yourself: upcoming dates from every project calendar, a saved chart that stays live, your favorites, recent work.Datasets, local or liveEdit a dataset in a spreadsheet grid, or pull data in from the plugins under the Datasets menu - weather stations, your own loggers, data repositories.Projects tie it togetherA project summary with everything linked to it in the rail: experiments, datasets, documents, tools and references, plus the team and the discussion.CarbonFlux Mini - soil respirationSoil CO2 efflux from a CarbonFlux Mini station: every closed-lid cycle becomes a flux, plotted over the deployment with the fit quality of each closure.Leaf area from a photoA leaf photographed on a sheet of paper becomes a calibrated area measurement, with the detected outline drawn back over the image.Point dendrometer radiusMini Field Station dendrometer counts converted to stem radius, anchored on a field DBH, with the growing season marked.RQLogger sealed-jar respirationCO2 production, O2 consumption and the respiratory quotient from one sealed-jar run, with the fitted rates over the analysis window.Statistics, ready to runA two-group t-test with its distributions, effect size and a plain-language reading of the result - one of the library's ready-made analyses.Tree core ring counterRings detected along a scanned core, counted and measured, with the boundaries marked for checking by eye.